Free Access
Fig. 10
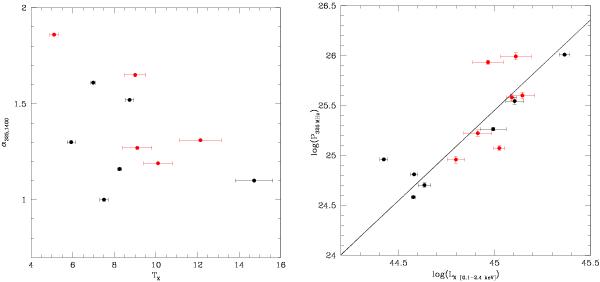
Left: spectral index of the radio haloes presented in this paper and collected from the literature in the range 325 MHz–1.4 GHz plotted as function of the cluster X-ray temperature. Right: Log LX – Log P325 MHZ correlation. The red points in each plot are the clusters from the GMRT 325 MHz follow up.
This figure is made of several images, please see below:
Current usage metrics show cumulative count of Article Views (full-text article views including HTML views, PDF and ePub downloads, according to the available data) and Abstracts Views on Vision4Press platform.
Data correspond to usage on the plateform after 2015. The current usage metrics is available 48-96 hours after online publication and is updated daily on week days.
Initial download of the metrics may take a while.