Free Access
Fig. 3
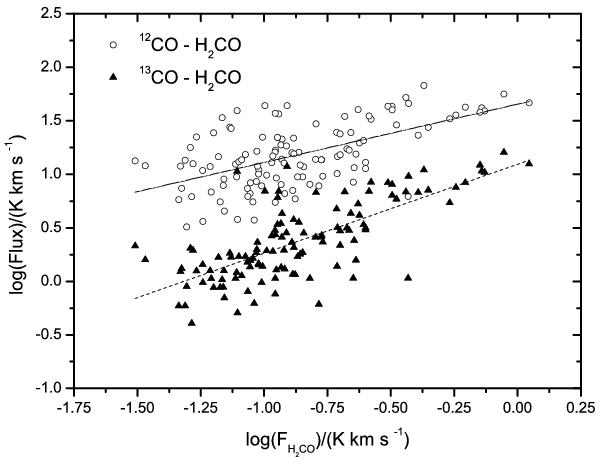
Correlation between the H2CO line flux and 12CO, 13CO line flux at corresponding points in MON R2, S156, DR17/L906, and M17/M18. The solid line is the linear fit for H2CO and 12CO flux data, and the dashed line is the linear fit for H2CO and 13CO.
Current usage metrics show cumulative count of Article Views (full-text article views including HTML views, PDF and ePub downloads, according to the available data) and Abstracts Views on Vision4Press platform.
Data correspond to usage on the plateform after 2015. The current usage metrics is available 48-96 hours after online publication and is updated daily on week days.
Initial download of the metrics may take a while.