Fig. 2
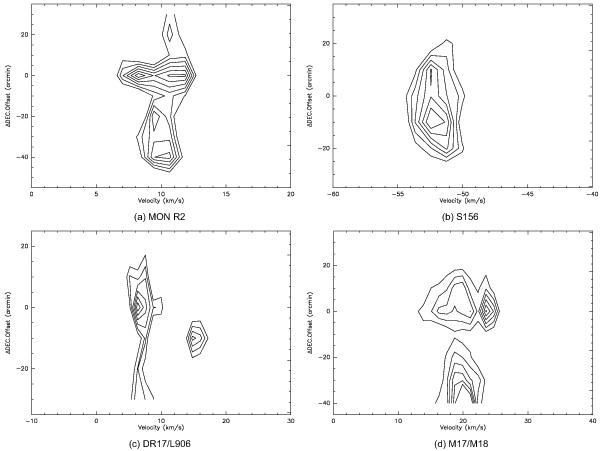
Position-velocity diagrams of H2CO for a) MON R2 and b) S156, regions along Dec for Δα = 0, for c) DR17/L906 region from offset (20, –30) to (–10, 20), and d) M17/M18 region from offset ( − 30, − 40) to (0, 30). For the MON R2, S156, and DR17/L906 regions: contour levels are –0.03 to –0.08 in steps of –0.01 K. For the M17/M18 region: contour levels are –0.03 to –0.18 in steps of –0.03 K.
Current usage metrics show cumulative count of Article Views (full-text article views including HTML views, PDF and ePub downloads, according to the available data) and Abstracts Views on Vision4Press platform.
Data correspond to usage on the plateform after 2015. The current usage metrics is available 48-96 hours after online publication and is updated daily on week days.
Initial download of the metrics may take a while.