Free Access
Fig. B.1
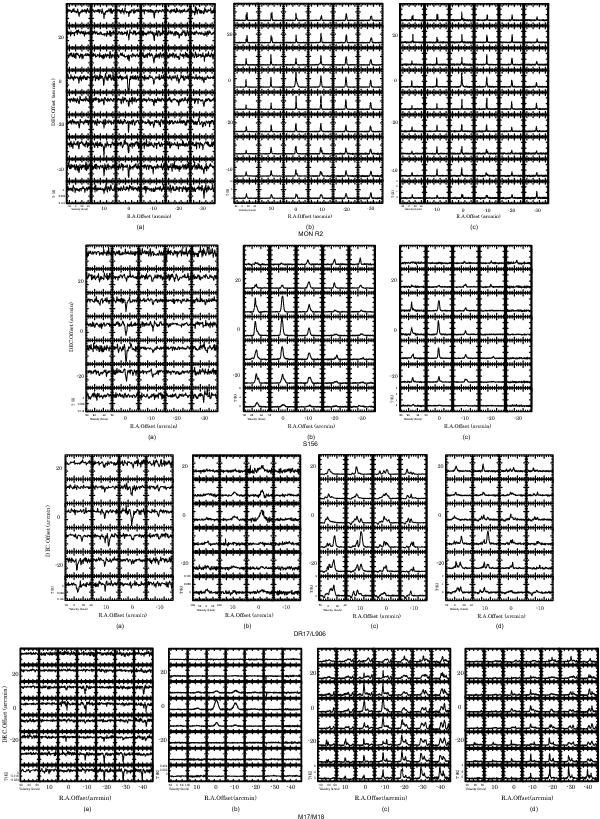
The spectra of a) H2CO, b) 12CO, and c) 13CO lines toward MON R2 and S156 regions. And the spectra of a) H2CO, b) H110α, c) 12CO, and d) 13CO lines toward DR17/L906 and M17/M18 regions.
Current usage metrics show cumulative count of Article Views (full-text article views including HTML views, PDF and ePub downloads, according to the available data) and Abstracts Views on Vision4Press platform.
Data correspond to usage on the plateform after 2015. The current usage metrics is available 48-96 hours after online publication and is updated daily on week days.
Initial download of the metrics may take a while.