Fig. A.5
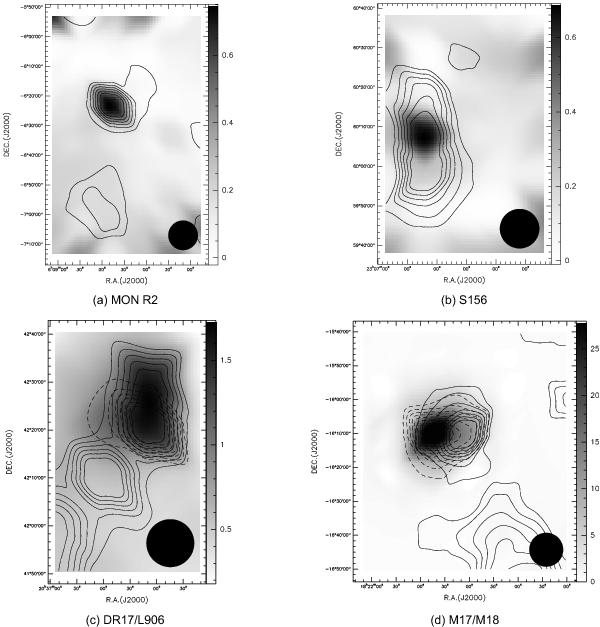
Location of the radio continuum emission (gray scale) overlaid on the H2CO observation lines (black contour lines) and H110α emission lines (dash contour lines) toward a) MON R2, b) S156, c) DR17/L906, and d) M17/M18. H2CO contour levels are the same as Fig. 1 for four regions. For the DR17/L906 region: H110α contour levels are 0.67, 0.89, 1.11, 1.33, 1.56, and 1.78 K km s-1; for the M17/M18 region: H110α contour levels are 2.91, 4.36, 5.81, 7.26, 8.72, 10.17, and 11.62 K km s-1. The gray bars are given in units of K.
Current usage metrics show cumulative count of Article Views (full-text article views including HTML views, PDF and ePub downloads, according to the available data) and Abstracts Views on Vision4Press platform.
Data correspond to usage on the plateform after 2015. The current usage metrics is available 48-96 hours after online publication and is updated daily on week days.
Initial download of the metrics may take a while.