Fig. 1
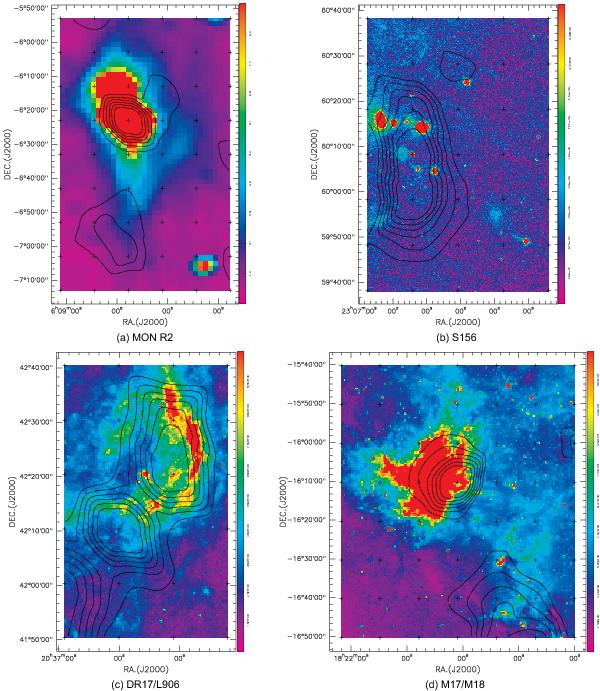
Contours and color-scale maps of integrated area toward a) MON R2, b) S156, c) DR17/L906, and d) M17/M18. The contour and color-scale map respectively represent the integrated intensities of the H2CO and the mid-infrared 8.28 μm MSX emission in S156, DR17/L906, and M17/M18 regions. For the MON R2 region, the color-scale map represents the IRAS 12 μm data. a) For the MON R2 region: contour levels are –0.17 to –0.46 in steps of –0.06 K km s-1. b) For the S156 region: contour levels are –0.09 to –0.25 in steps of –0.03 K km s-1. c) For the DR17/L906 region: contour levels are –0.12 to –0.32 in steps of –0.04 K km s-1. d) For the M17/M18 region: contour levels are –0.42 to –1.11 in steps of –0.14 K km s-1.
Current usage metrics show cumulative count of Article Views (full-text article views including HTML views, PDF and ePub downloads, according to the available data) and Abstracts Views on Vision4Press platform.
Data correspond to usage on the plateform after 2015. The current usage metrics is available 48-96 hours after online publication and is updated daily on week days.
Initial download of the metrics may take a while.