Fig. 1
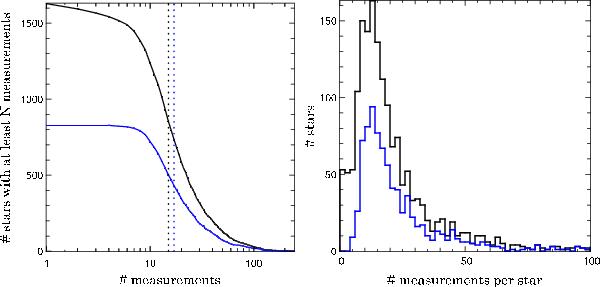
Statistical distribution of the number of measurements in the CORALIE volume-limited sample (1647 stars). The blue curve represents the subsample (822 stars) of the best candidates for a Doppler-planet search survey (low chromospheric activity index, no high-rotation stars, and no binaries), while the black line is for the entire sample. The histograms of the number of Doppler measurements are plotted on the right, and the curves in the left panel are the inverse cumulative distribution functions of measurements (i.e. the number of stars with at least N data points). The dashed lines represent the median of the distributions for all them and for the subsample (respectively 15 and 17 Doppler measurements).
Current usage metrics show cumulative count of Article Views (full-text article views including HTML views, PDF and ePub downloads, according to the available data) and Abstracts Views on Vision4Press platform.
Data correspond to usage on the plateform after 2015. The current usage metrics is available 48-96 hours after online publication and is updated daily on week days.
Initial download of the metrics may take a while.