Free Access
Fig. 5
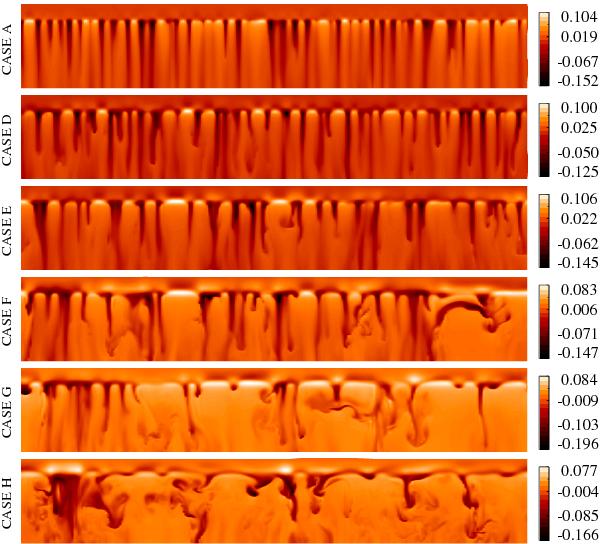
Vertical cuts of the computational box along x = 3 at an arbitrary
instant. The colour scale represents temperature fluctuation from its horizontal
mean, i.e.,  , in
units of 5063.52 K. Rows correspond to different runs as labeled on the left.
, in
units of 5063.52 K. Rows correspond to different runs as labeled on the left.
Current usage metrics show cumulative count of Article Views (full-text article views including HTML views, PDF and ePub downloads, according to the available data) and Abstracts Views on Vision4Press platform.
Data correspond to usage on the plateform after 2015. The current usage metrics is available 48-96 hours after online publication and is updated daily on week days.
Initial download of the metrics may take a while.