Free Access
Fig. 4
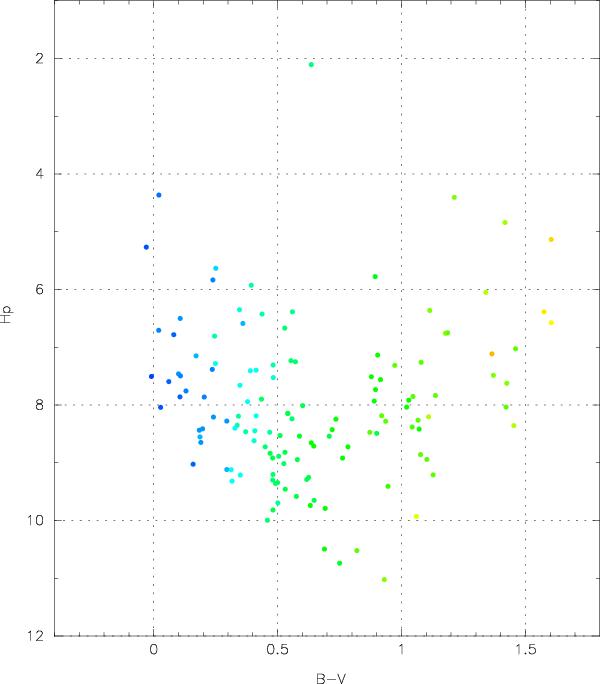
Colour–magnitude diagram for stars within a 3 degrees radius from Polaris, and with relative parallax errors below 15 percent. This diagram should be compared with Fig. 4 in Turner (2009). The colours of the dots reflect the spectral types of the stars, from blue (B) to red (M).
Current usage metrics show cumulative count of Article Views (full-text article views including HTML views, PDF and ePub downloads, according to the available data) and Abstracts Views on Vision4Press platform.
Data correspond to usage on the plateform after 2015. The current usage metrics is available 48-96 hours after online publication and is updated daily on week days.
Initial download of the metrics may take a while.