Free Access
Fig. 4
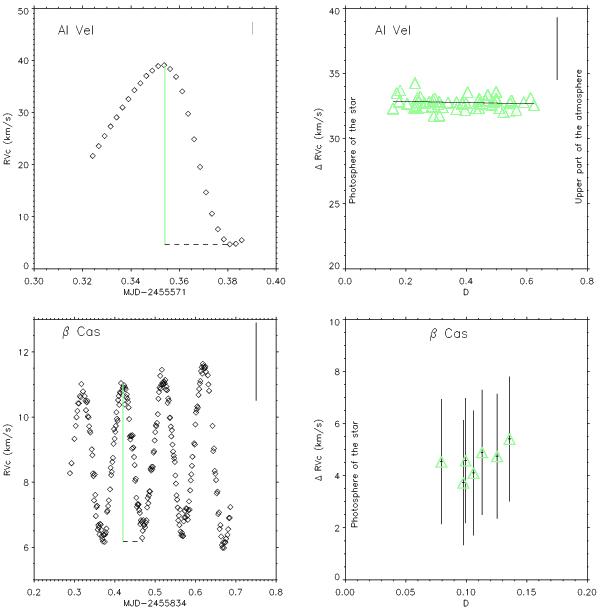
Top: RVc as a function of the MJD in the case of the FeII 5234.625 Å spectral line, and amplitude of the RVc curves as a function of the spectral line depth (D) for AI Vel. Typical error bars are indicated in the upper right of each panel. Bottom: the same for β Cas f the FeII 4508.288 Å spectral line.
Current usage metrics show cumulative count of Article Views (full-text article views including HTML views, PDF and ePub downloads, according to the available data) and Abstracts Views on Vision4Press platform.
Data correspond to usage on the plateform after 2015. The current usage metrics is available 48-96 hours after online publication and is updated daily on week days.
Initial download of the metrics may take a while.