Fig. 6
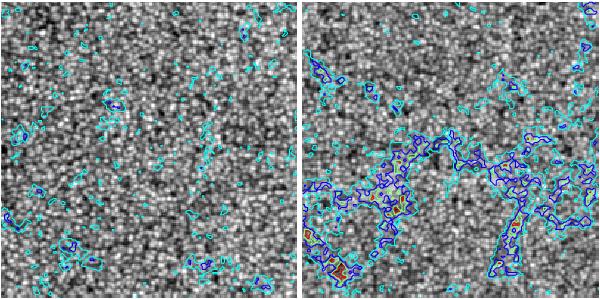
100 × 100 arcsec insets of a quiet region near disc centre (μ > 0.99, left) and active region NOAA 11187 (0.82 < μ < 0.91, right) of the continuum intensity image from April 15, 2011. The cyan contours indicate the boundary of network and faculae. The blue, green and red contours correspond to ⟨Bl⟩/μ = 100G, 280G and 500G, respectively.
Current usage metrics show cumulative count of Article Views (full-text article views including HTML views, PDF and ePub downloads, according to the available data) and Abstracts Views on Vision4Press platform.
Data correspond to usage on the plateform after 2015. The current usage metrics is available 48-96 hours after online publication and is updated daily on week days.
Initial download of the metrics may take a while.