Fig. 5
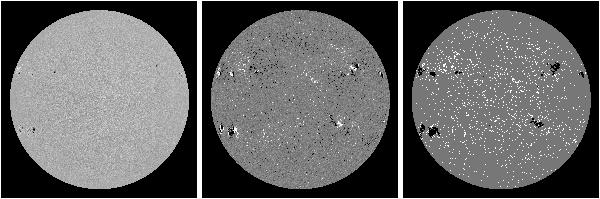
HMI continuum intensity image (left), magnetogram (middle) and classification image (right) from May 30, 2011. The classification image indicates the positions of the pixels classed as network and faculae (white), and sunspots and pores (black). The latter includes magnetic signal adjoined to sunspots and pores, counted to them to avoid counting their magnetic canopy, possible bright structures within penumbrae and straylight as network and faculae erroneously. The continuum intensity image and magnetogram are scaled between 0.6 and 1.2, and −80G and 80G respectively as in Fig. 4
Current usage metrics show cumulative count of Article Views (full-text article views including HTML views, PDF and ePub downloads, according to the available data) and Abstracts Views on Vision4Press platform.
Data correspond to usage on the plateform after 2015. The current usage metrics is available 48-96 hours after online publication and is updated daily on week days.
Initial download of the metrics may take a while.