Fig. 4
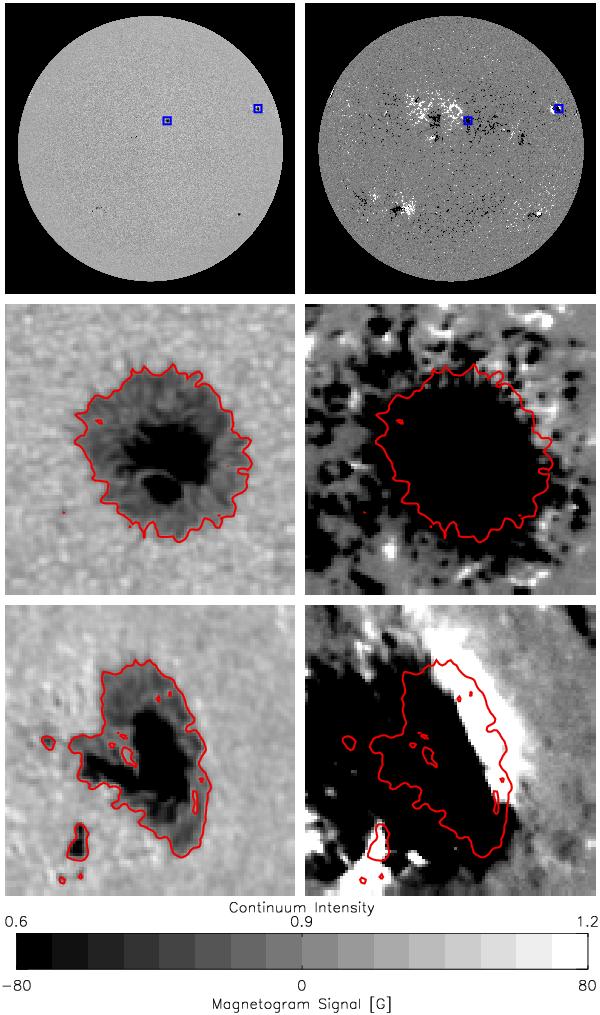
Continuum intensity image (top left) and magnetogram (top right) from July 18, 2011 and the corresponding 50 × 50arcsec insets of the boxed sunspot features near disc centre (middle panels) and limb (bottom panels). The red contours represent the continuum intensity sunspot boundary (the IC = 0.89 locus). The magnetograms have been saturated at ± 80G to highlight the extension of the magnetic signal from these sunspots beyond the intensity boundary (see grey scale below the figure).
Current usage metrics show cumulative count of Article Views (full-text article views including HTML views, PDF and ePub downloads, according to the available data) and Abstracts Views on Vision4Press platform.
Data correspond to usage on the plateform after 2015. The current usage metrics is available 48-96 hours after online publication and is updated daily on week days.
Initial download of the metrics may take a while.