Fig. 3
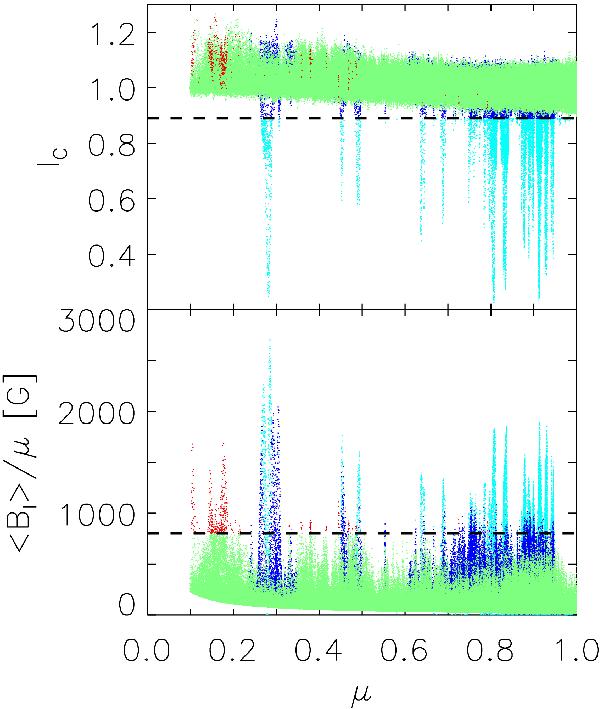
Continuum intensity, IC versus μ (top) and ⟨Bl⟩/μ versus μ (bottom) scatter plots of pixels counted as network and faculae (green) from June 2, 2011. The pixels counted as sunspots and pores by the continuum intensity threshold and the magnetic extension removal procedure (see text) are represented by the cyan and blue dots respectively. The red dots represent network and faculae pixels that lie above the cutoff ⟨Bl⟩/μ level. The dashed lines denote the continuum intensity threshold (top) and the cutoff ⟨Bl⟩/μ level (bottom).
Current usage metrics show cumulative count of Article Views (full-text article views including HTML views, PDF and ePub downloads, according to the available data) and Abstracts Views on Vision4Press platform.
Data correspond to usage on the plateform after 2015. The current usage metrics is available 48-96 hours after online publication and is updated daily on week days.
Initial download of the metrics may take a while.