Fig. 20
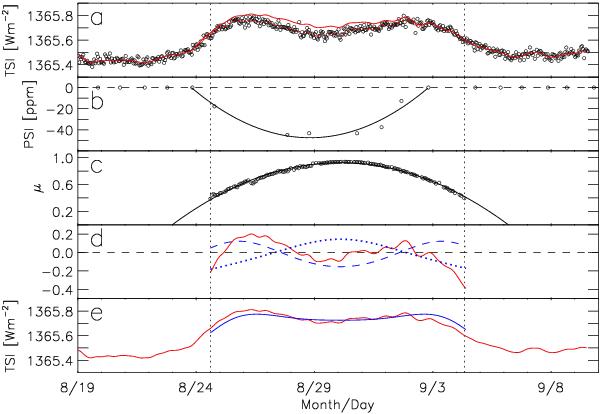
a) Total solar irradiance, TSI from DIARAD on SoHO/VIRGO (open circles) for the period of August 19 to September 9, 1996. The dotted and solid red curves represent the interpolated and smoothed version before and after subtracting sunspot darkening. b) Photometric Sunspot Index, PSI (open circles) by Chapman et al. (1994) and the quadratic polynomial fit to the non-zero points (curve). The dashed line marks the zero level. c) Position of NOAA 7986 as estimated from MDI magnetograms (open circles) and the quadratic polynomial fit (curve). d) TSI minus sunspot darkening (red curve) and model of facular contribution to TSI based on observed intensity contrast in the continuum (blue dashed curve) and line core (blue dotted curve), each mean subtracted and normalized by the area bound between the time series and the zero level (black dashed line). e) TSI minus sunspot darkening (red curve) and the multiple linear regression fit of the continuum and line core models (blue solid curve). The dotted lines running down all the panels mark the period where NOAA 7986 was entirely on the solar disc in MDI magnetograms.
Current usage metrics show cumulative count of Article Views (full-text article views including HTML views, PDF and ePub downloads, according to the available data) and Abstracts Views on Vision4Press platform.
Data correspond to usage on the plateform after 2015. The current usage metrics is available 48-96 hours after online publication and is updated daily on week days.
Initial download of the metrics may take a while.