Fig. 2
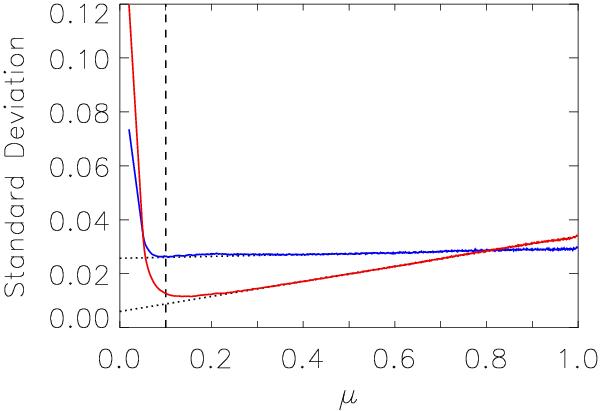
Standard deviation of quiet Sun (⟨Bl⟩/μ ≤ 10G) intensity at continuum, σIC,QS (red) and line core, σIL,QS (blue) as a function of μ. The dotted lines represents the linear fit to σIC,QS and σIL,QS over the range 0.3 ≤ μ ≤ 1.0 (largely hidden due to the close agreement), extrapolated to μ = 0. The dashed line denotes the threshold (μ = 0.1) below which pixels were excluded from the rest of the study in view of the scatter in measured intensity.
Current usage metrics show cumulative count of Article Views (full-text article views including HTML views, PDF and ePub downloads, according to the available data) and Abstracts Views on Vision4Press platform.
Data correspond to usage on the plateform after 2015. The current usage metrics is available 48-96 hours after online publication and is updated daily on week days.
Initial download of the metrics may take a while.