Fig. 18
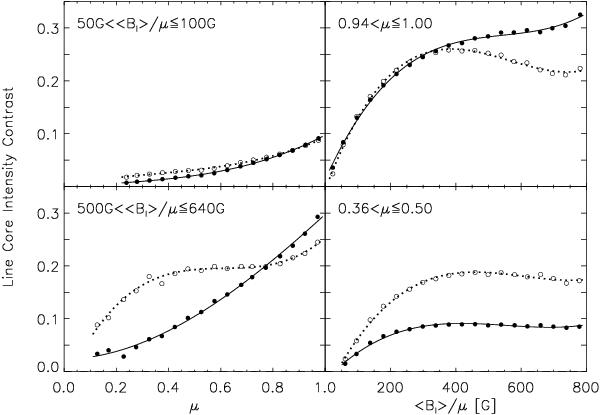
Selected line core intensity (open circles and dotted curves) and corresponding residual intensity (filled circles and solid curves) contrast CLV (left) and contrast versus ⟨Bl⟩/μ (right) profiles. The circles represent the mean of measured contrast binned as in Figs. 8 and 10 and the curves the corresponding cubic polynomial fits. The selected profiles correspond to quiet Sun network (top left), active region faculae (bottom left), disc centre (top right) and near limb (bottom right).
Current usage metrics show cumulative count of Article Views (full-text article views including HTML views, PDF and ePub downloads, according to the available data) and Abstracts Views on Vision4Press platform.
Data correspond to usage on the plateform after 2015. The current usage metrics is available 48-96 hours after online publication and is updated daily on week days.
Initial download of the metrics may take a while.