Fig. 17
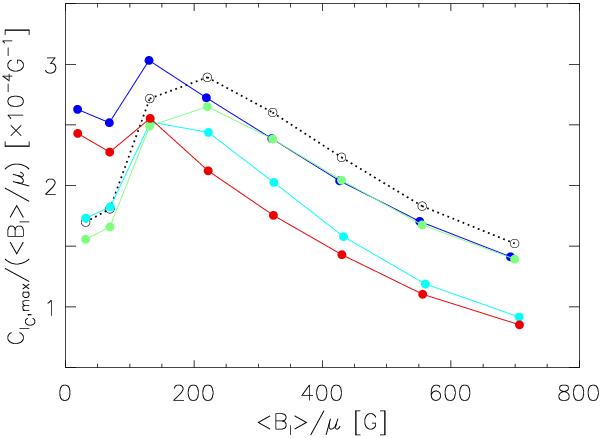
Continuum intensity specific contrast as a function of ⟨Bl⟩/μ from Fig. 14 (open circles). The cyan, blue and green filled circles represent the same quantity obtained by omitting the magnetic extension removal procedure, spatially binning the data set by 4 × 4 pixels and converting measured contrast to 6768 Å respectively. The red filled circles represent the result of taking into account all these three considerations. The points in each series are joined by straight lines to aid the eye.
Current usage metrics show cumulative count of Article Views (full-text article views including HTML views, PDF and ePub downloads, according to the available data) and Abstracts Views on Vision4Press platform.
Data correspond to usage on the plateform after 2015. The current usage metrics is available 48-96 hours after online publication and is updated daily on week days.
Initial download of the metrics may take a while.