Fig. 16
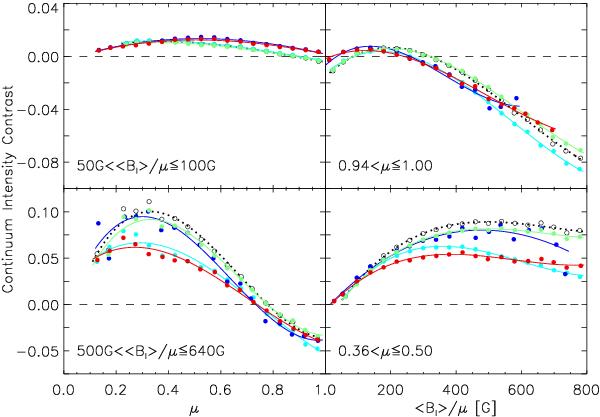
Selected continuum intensity contrast CLV (left) and contrast versus ⟨Bl⟩/μ (right) profiles from Figs. 7 and 9 (open circles and dotted curves). The selected profiles correspond to quiet Sun network (top left), active region faculae (bottom left), disc centre (top right) and near limb (bottom right). The cyan, blue and green series denote the profiles obtained by omitting the magnetic extension removal procedure, spatially binning the data set by 4 × 4 pixels and converting measured contrast to 6768 Å respectively. The red series indicates the results of taking into account all these three considerations. The circles represent the mean of measured contrast binned as in the referenced figures and the curves the corresponding third-order polynomial fits. The dashed lines mark the mean quiet Sun level.
Current usage metrics show cumulative count of Article Views (full-text article views including HTML views, PDF and ePub downloads, according to the available data) and Abstracts Views on Vision4Press platform.
Data correspond to usage on the plateform after 2015. The current usage metrics is available 48-96 hours after online publication and is updated daily on week days.
Initial download of the metrics may take a while.