Fig. 14
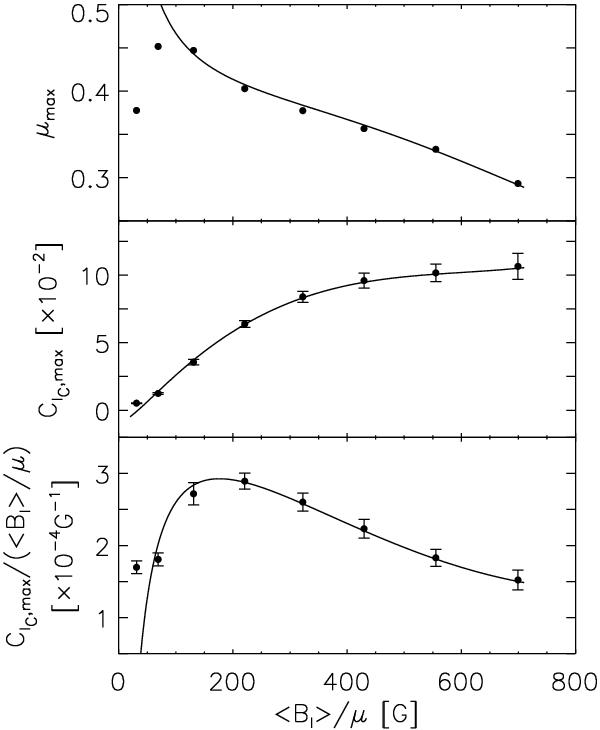
Heliocentric angle at which continuum intensity contrast reaches its maximum, μmax (top), as well as the contrast, CIC,max (middle) and specific contrast, CIC,max/(⟨Bl⟩/μ) (bottom) there, as a function of ⟨Bl⟩/μ. The filled circles represent the values derived from the cubic polynomial fit to the contrast CLV profiles (Fig. 7) and the error bars the uncertainty in CIC,max and CIC,max/(⟨Bl⟩/μ). The curves follow the solution from the surface fit to measured continuum intensity contrast (Eq. (3)).
Current usage metrics show cumulative count of Article Views (full-text article views including HTML views, PDF and ePub downloads, according to the available data) and Abstracts Views on Vision4Press platform.
Data correspond to usage on the plateform after 2015. The current usage metrics is available 48-96 hours after online publication and is updated daily on week days.
Initial download of the metrics may take a while.