Fig. 9
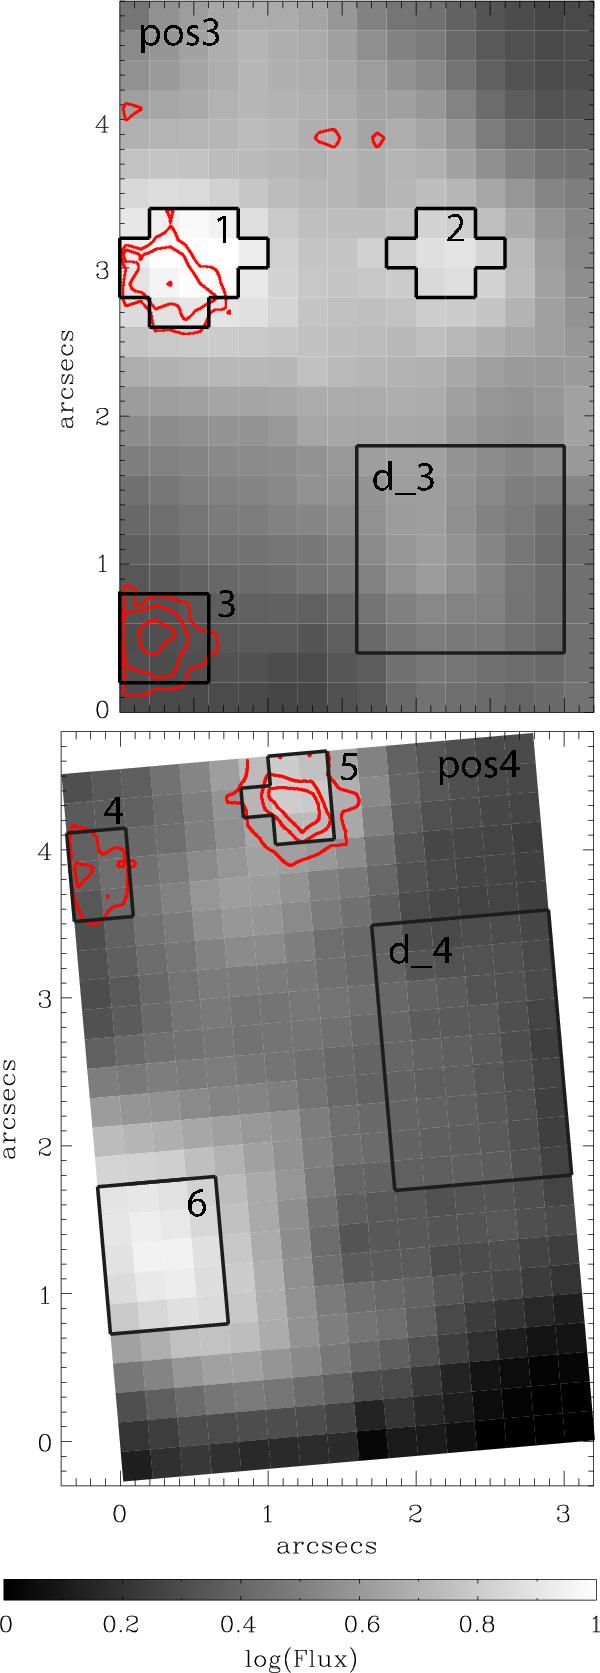
IFU positions 3 and 4. Shown in greyscale is the integrated Hα flux. Red contours show the integrated red WR bump flux (dominated by C ivλ5808 emission) originating from WC-type WR stars. The black outlines show the 6 regions from which we extracted summed spectra for our abundance analysis.
Current usage metrics show cumulative count of Article Views (full-text article views including HTML views, PDF and ePub downloads, according to the available data) and Abstracts Views on Vision4Press platform.
Data correspond to usage on the plateform after 2015. The current usage metrics is available 48-96 hours after online publication and is updated daily on week days.
Initial download of the metrics may take a while.