Fig. 8
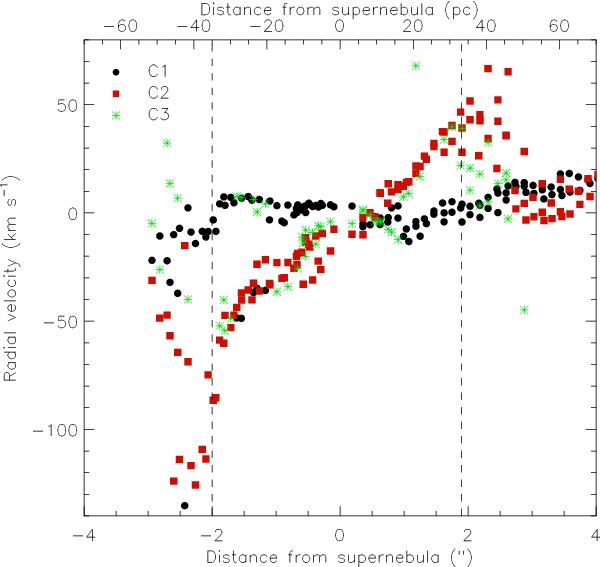
Position-velocity diagram along the pseudoslit crossing the supernebula, and oriented along the maximum velocity gradient, as shown in Fig. 6. Velocities are shown relative to vsys = − 390 km s-1 (Schwartz & Martin 2004). The vertical dashed lines indicate the region within which both C2 and C3 follow the same steep gradient. We interpret this as evidence of an outflow from the supernebula clusters.
Current usage metrics show cumulative count of Article Views (full-text article views including HTML views, PDF and ePub downloads, according to the available data) and Abstracts Views on Vision4Press platform.
Data correspond to usage on the plateform after 2015. The current usage metrics is available 48-96 hours after online publication and is updated daily on week days.
Initial download of the metrics may take a while.