Fig. 7
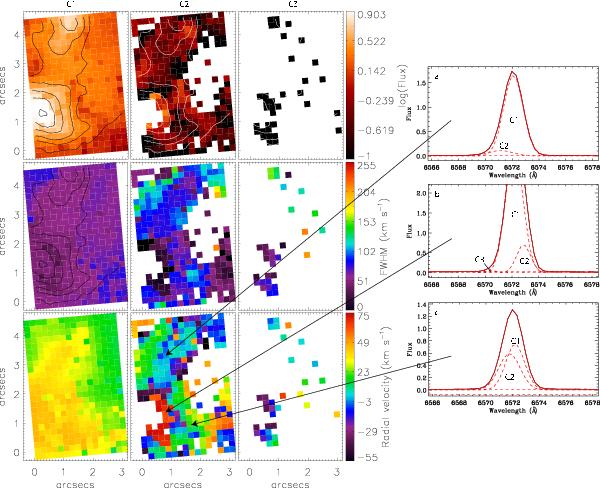
Pos 4 Hα flux (top panels), FWHM (middle panels) maps in units of km s-1 (corrected for instrumental broadening), and radial velocity maps (bottom panels) in units of km s-1, relative to vsys for the three identified line components. Contours show the summed Hα intensity. Example Hα line profiles and their best multi-component fits are shown for select spaxels as discussed in the text.
Current usage metrics show cumulative count of Article Views (full-text article views including HTML views, PDF and ePub downloads, according to the available data) and Abstracts Views on Vision4Press platform.
Data correspond to usage on the plateform after 2015. The current usage metrics is available 48-96 hours after online publication and is updated daily on week days.
Initial download of the metrics may take a while.