Free Access
Fig. 2
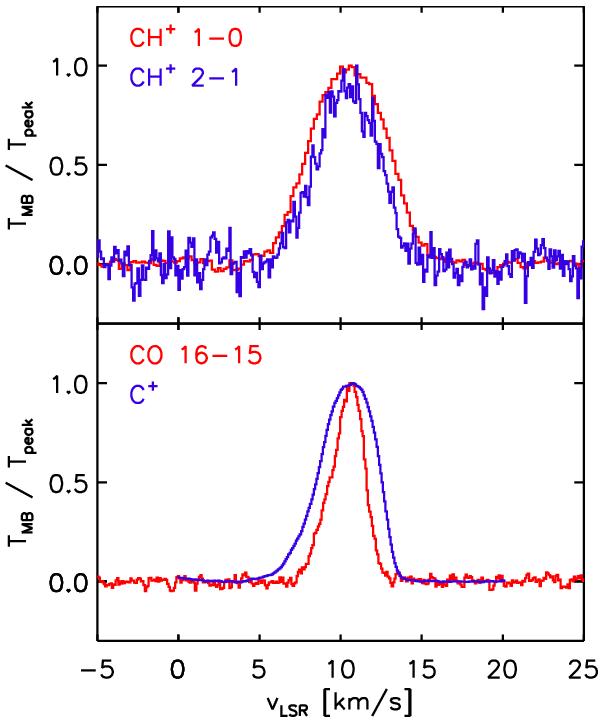
Top panel: line profiles of CH+ 2−1 and 1−0 transitions corresponding to the average of H- and V-polarizations observed with Herschel/HIFI toward the CO+ peak in the Orion Bar. Bottom panel: line profiles of C+ and CO 16–15, for comparison, observed with Herschel/HIFI toward the CO+ peak in the Orion Bar.
Current usage metrics show cumulative count of Article Views (full-text article views including HTML views, PDF and ePub downloads, according to the available data) and Abstracts Views on Vision4Press platform.
Data correspond to usage on the plateform after 2015. The current usage metrics is available 48-96 hours after online publication and is updated daily on week days.
Initial download of the metrics may take a while.