Fig. 2
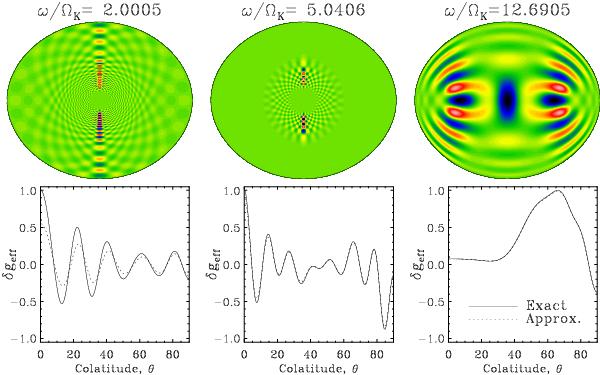
Comparison between δgeff and
 for three modes. The upper row shows the meridional cross-section of the three
modes, whereas the lower row compares the two calculations for the perturbation to
the effective gravity at the stellar surface, between one of the poles
(θ = 0°) and the equator
(θ = 90°). For the middle and right mode, the two
curves nearly overlap, making it hard to distinguish them.
for three modes. The upper row shows the meridional cross-section of the three
modes, whereas the lower row compares the two calculations for the perturbation to
the effective gravity at the stellar surface, between one of the poles
(θ = 0°) and the equator
(θ = 90°). For the middle and right mode, the two
curves nearly overlap, making it hard to distinguish them.
Current usage metrics show cumulative count of Article Views (full-text article views including HTML views, PDF and ePub downloads, according to the available data) and Abstracts Views on Vision4Press platform.
Data correspond to usage on the plateform after 2015. The current usage metrics is available 48-96 hours after online publication and is updated daily on week days.
Initial download of the metrics may take a while.