Fig. 11
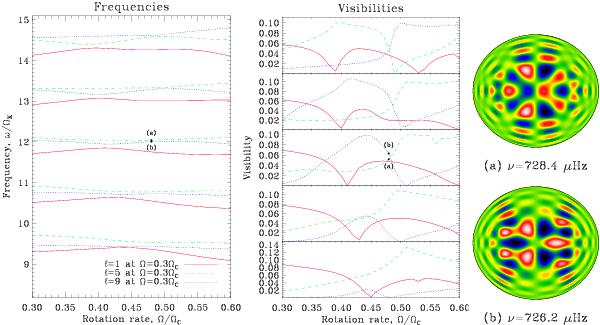
A set of avoided crossings between ℓ = 1, 5 and 9 modes with m = 1. The linestyles and colours indicate the ℓ value at Ω = 0.3 ΩC (note that an avoided crossing has already taken place between the uppermost ℓ = 5 and 9 modes, hence the “swapped” identification compared to the other modes). The left panel shows the frequencies, the middle panel gives the visibilities in the CoRoT photometric band for i = 30° and the right panel shows the meridional cross-sections of two modes undergoing an avoided crossing, and labelled by “(a)” and “(b)” in the two left panels. (This figure is available in color in electronic form.)
Current usage metrics show cumulative count of Article Views (full-text article views including HTML views, PDF and ePub downloads, according to the available data) and Abstracts Views on Vision4Press platform.
Data correspond to usage on the plateform after 2015. The current usage metrics is available 48-96 hours after online publication and is updated daily on week days.
Initial download of the metrics may take a while.