Fig. 5
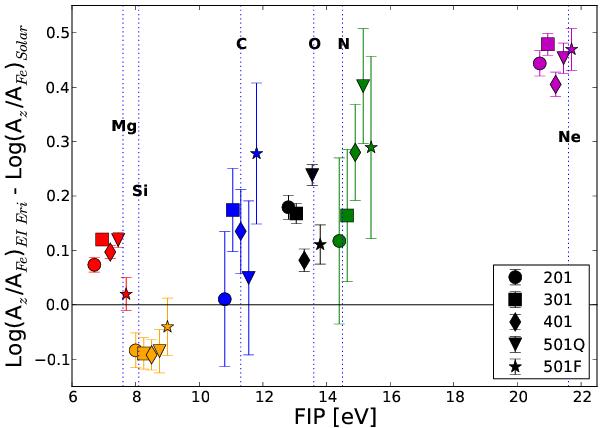
Coronal abundances relative to Fe and expressed relative to the solar X/Fe abundance ratio (Asplund et al. 2009). Points from different observations are progressively shifted to the right along the horizontal axis in the order in which they were taken (~2 days apart) to enhance visibility and to emphasize the time variability.
Current usage metrics show cumulative count of Article Views (full-text article views including HTML views, PDF and ePub downloads, according to the available data) and Abstracts Views on Vision4Press platform.
Data correspond to usage on the plateform after 2015. The current usage metrics is available 48-96 hours after online publication and is updated daily on week days.
Initial download of the metrics may take a while.