Fig. 5
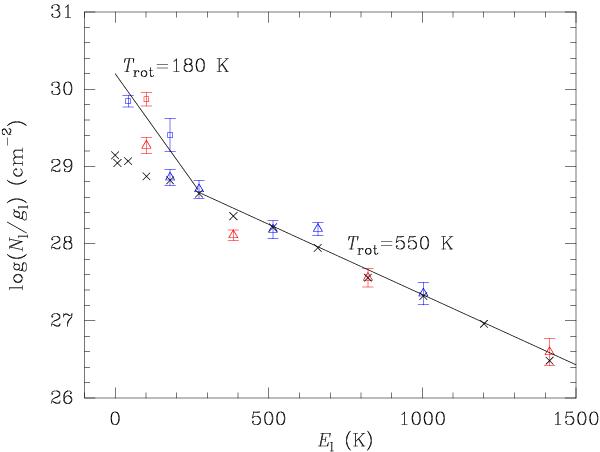
Population diagram of H3O+ (metastable levels) in Arp 220. Red and blue symbols correspond to ortho and para levels, respectively. Columns derived from pure-inversion and rotation-inversion lines are shown with triangles and squares, respectively. The crosses indicate the expected population distribution for Trot = 550 K and a fixed ortho-to-para ratio of 1.
Current usage metrics show cumulative count of Article Views (full-text article views including HTML views, PDF and ePub downloads, according to the available data) and Abstracts Views on Vision4Press platform.
Data correspond to usage on the plateform after 2015. The current usage metrics is available 48-96 hours after online publication and is updated daily on week days.
Initial download of the metrics may take a while.