Fig. 4
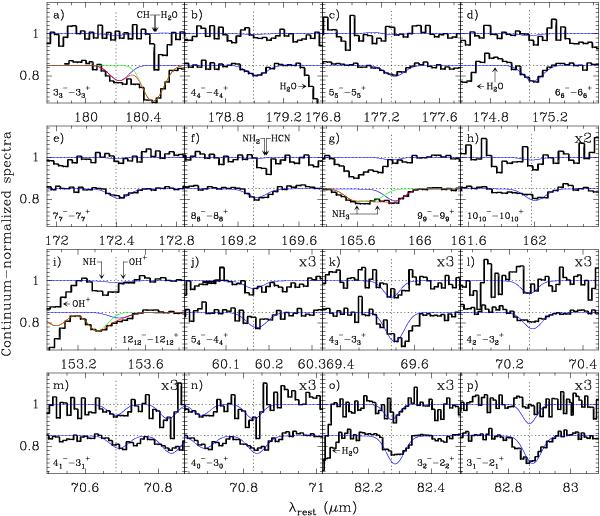
Continuum-normalized spectra around the H3O+ lines in NGC 4418 (upper histograms) and Arp 220 (lower histograms). The dotted vertical lines indicate the rest wavelengths of the transitions for the nominal redshifts of z = 0.00705 (NGC 4418) and 0.0181 (Arp 220). Panels a) − i) show the pure inversion, metastable lines of H3O+, while panels j) − p) show the rotation-inversion lines at λ < 100 μm. The spectra in panels h) and j) − p) have been scaled by a factor 2 and 3, respectively. The  and
and  lines at ≈ 181 μm are strongly contaminated by lines of CH and H
 O, and are not shown. Close features due to other species and potential contaminations are indicated. In panels f) and i), the contamination by NH2, HCN, and OH+ is expected to be small (see text). The blue lines show the best-fit model for H3O+; the green lines in panels g) and i) show model fits for NH3 and NH lines; red is the total.
Current usage metrics show cumulative count of Article Views (full-text article views including HTML views, PDF and ePub downloads, according to the available data) and Abstracts Views on Vision4Press platform.
Data correspond to usage on the plateform after 2015. The current usage metrics is available 48-96 hours after online publication and is updated daily on week days.
Initial download of the metrics may take a while.