Fig. C.1
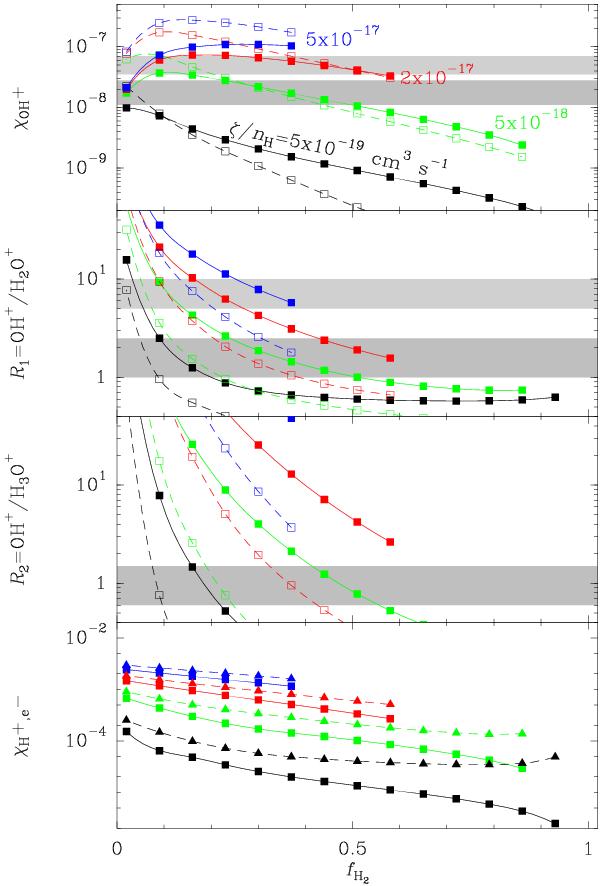
Predicted OH+ abundance (upper panel), OH+/H2O+ and OH+/H3O+ ratios (mid panels), and H+ and e− abundances (lower panel), as a function of the molecular fraction fH2 (up to approximately  , see Eq. (2)). Each curve corresponds to a value of ζ/nH, indicated in the upper panel in units of cm3 s-1. Solid and dashed curves correspond to Tgas = 150 and 550 K, respectively. The inferred values of χOH+, R1, and R2, in the nuclear regions of NGC 4418 and Arp 220, and in the Cextended of Arp 220, are indicated with the shaded dark and light regions, respectively. In the lower panel, squares and triangles show the predicted χH+ and χe.
Current usage metrics show cumulative count of Article Views (full-text article views including HTML views, PDF and ePub downloads, according to the available data) and Abstracts Views on Vision4Press platform.
Data correspond to usage on the plateform after 2015. The current usage metrics is available 48-96 hours after online publication and is updated daily on week days.
Initial download of the metrics may take a while.