Fig. B.1
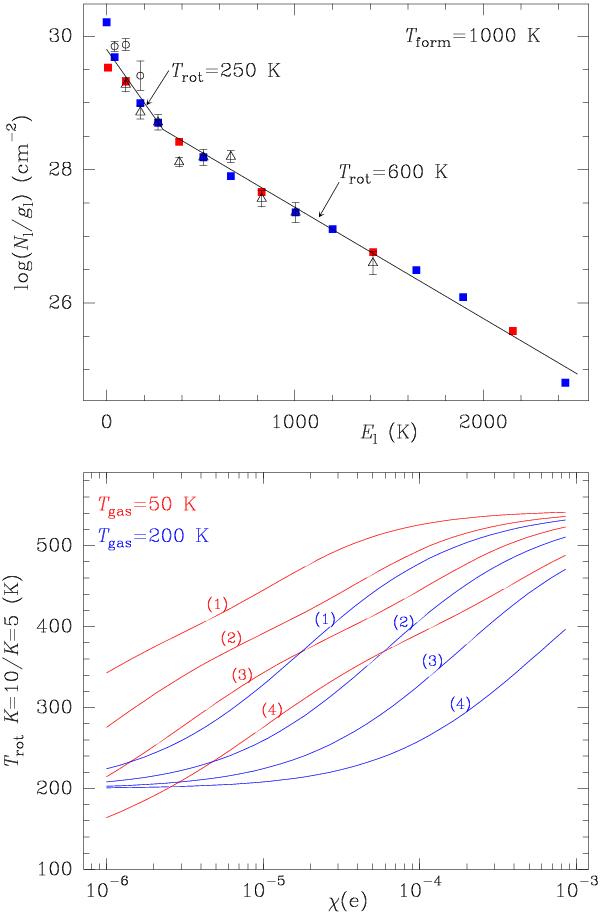
a) The H3O+ rotation diagram (triangles), calculated in the optically thin limit. The colored squares (red: ortho, blue: para) show the expected column density distribution for a formation temperature of Tform = 1000 K, and neglecting collisional relaxation. The two solid lines correspond to rotational temperatures of Trot = 250 and 600 K. b) The rotational temperature of the  metastable level of H3O+ relative to the
  one as a function of the electron abundance χ(e) for two adopted values of Tgas (50 and 200 K) and four assumed values of
  (curves 1), 1 × 10⁻¹⁰ (2), 3 × 10⁻¹⁰ (3), and 1 × 10⁻⁹ cm3 s-1 (4).
Current usage metrics show cumulative count of Article Views (full-text article views including HTML views, PDF and ePub downloads, according to the available data) and Abstracts Views on Vision4Press platform.
Data correspond to usage on the plateform after 2015. The current usage metrics is available 48-96 hours after online publication and is updated daily on week days.
Initial download of the metrics may take a while.