Fig. 1
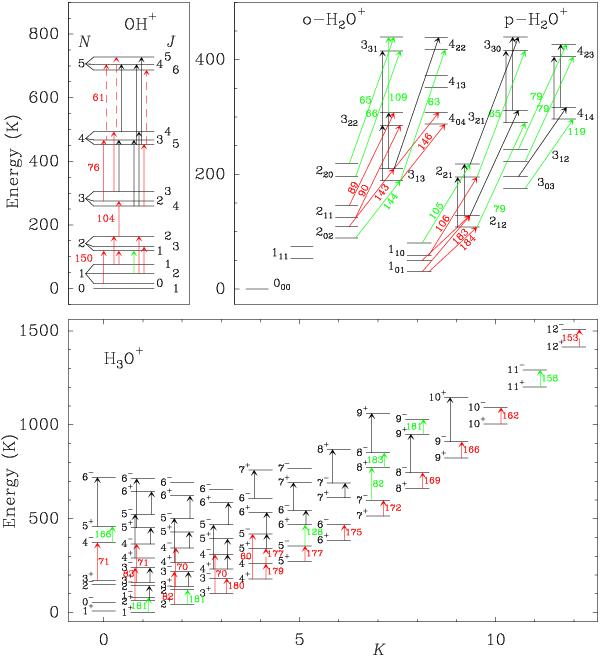
Energy level diagrams of OH+, H2O+, and H3O+, showing with arrows the transitions that lie within the PACS range; colored numbers indicate round-off wavelengths in μm. The fine-structure splitting of the OH+ and H2O+ levels is out of scale. Solid-red arrows mark the lines detected in NGC 4418 and/or Arp 220; dashed-red arrows indicate marginal detection in any of the sources; green arrows indicate blended lines, and black arrows show undetected lines.
Current usage metrics show cumulative count of Article Views (full-text article views including HTML views, PDF and ePub downloads, according to the available data) and Abstracts Views on Vision4Press platform.
Data correspond to usage on the plateform after 2015. The current usage metrics is available 48-96 hours after online publication and is updated daily on week days.
Initial download of the metrics may take a while.