Fig. 2
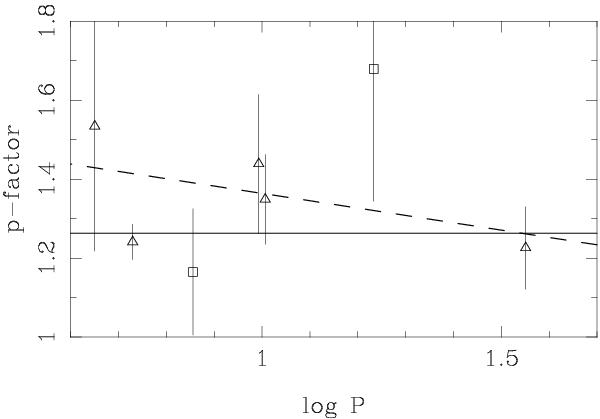
The p-factor plotted versus log period for the seven stars that have an error in p smaller than 0.4. The open squares indicate the two stars for which the radius was fixed from the PR relation. Also plotted is a line indicating the best constant value of p = 1.264, while the dashed lines represent the p-factor relation proposed by Storm et al. (2011a), p = 1.550 − 0.186log P.
Current usage metrics show cumulative count of Article Views (full-text article views including HTML views, PDF and ePub downloads, according to the available data) and Abstracts Views on Vision4Press platform.
Data correspond to usage on the plateform after 2015. The current usage metrics is available 48-96 hours after online publication and is updated daily on week days.
Initial download of the metrics may take a while.