Fig. 4
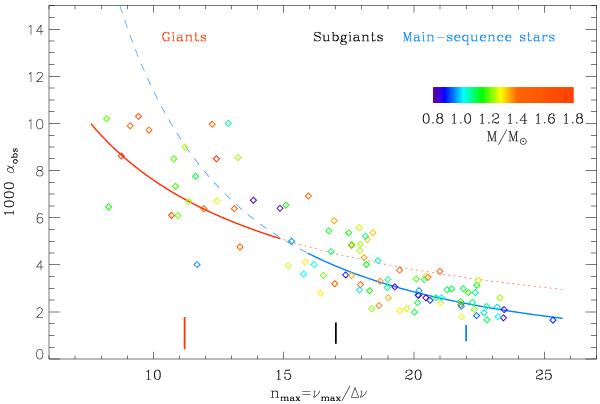
Curvature 103 αobs as a function of nmax = νmax/Δν. The thick line corresponds to the fit in  established for red giants, and the dotted line to its extrapolation towards larger nmax. The dashed line provides an acceptable fit in
  valid for main-sequence stars. Error bars indicate the typical 1-σ uncertainties in three different domains. The color code of the symbols provides an estimate of the stellar mass; the colors of the lines correspond to the different regimes.
Current usage metrics show cumulative count of Article Views (full-text article views including HTML views, PDF and ePub downloads, according to the available data) and Abstracts Views on Vision4Press platform.
Data correspond to usage on the plateform after 2015. The current usage metrics is available 48-96 hours after online publication and is updated daily on week days.
Initial download of the metrics may take a while.