Fig. 3
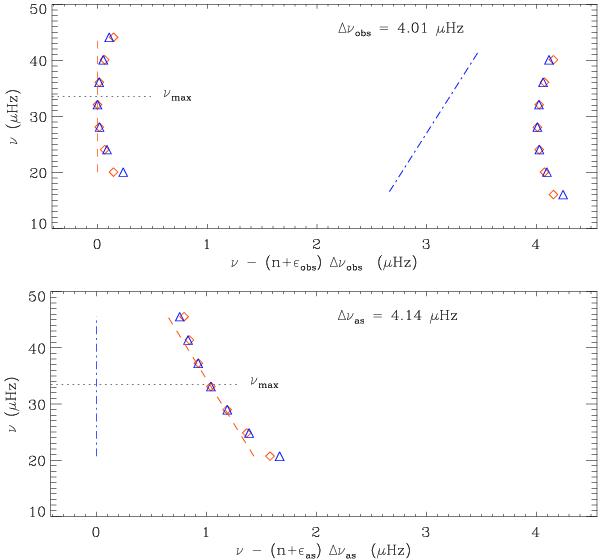
Échelle diagrams of the radial modes of a typical red-clump giant, comparing the asymptotic expansion (Eq. (6), blue triangles) and the development describing the curvature (Eq. (9), red diamonds). Top: diagram based on Δνobs observed at νmax; the dashed line indicates the vertical asymptotic line at νmax; the dot-dashed line indicates the asymptotic line at high frequency. For clarity, the ridge has been duplicated modulo Δνobs. Bottom: diagram based on Δνas; the dot-dashed line indicates the vertical asymptotic line at high frequency.
Current usage metrics show cumulative count of Article Views (full-text article views including HTML views, PDF and ePub downloads, according to the available data) and Abstracts Views on Vision4Press platform.
Data correspond to usage on the plateform after 2015. The current usage metrics is available 48-96 hours after online publication and is updated daily on week days.
Initial download of the metrics may take a while.