Fig. 5
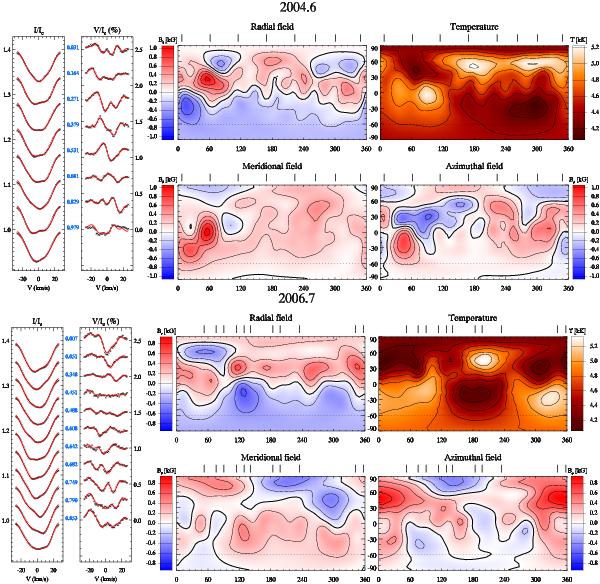
Magnetic field topology and temperature distribution of II Peg at epochs 2004.6 and 2006.7. For each epoch the two columns on the left compare the observed Stokes I and V LSD profiles (symbols) and the theoretical spectrum synthesis fit (solid lines). Spectra corresponding to different rotational phases are shifted vertically. The scale is given in % for Stokes V and in units of the continuum intensity for Stokes I. The four rectangular maps represent surface distributions of the radial, meridional, and azimuthal magnetic field components and corresponding temperature reconstructed for each epoch. The contours are plotted with a step of 0.2 kG over the magnetic maps and with a step of 200 K over the temperature distributions. The thick contour lines indicate where the field changes sign in the magnetic maps. The vertical bars above each rectangular panel indicate rotational phases of individual observations. The rotational phase runs from right to left on all maps.
Current usage metrics show cumulative count of Article Views (full-text article views including HTML views, PDF and ePub downloads, according to the available data) and Abstracts Views on Vision4Press platform.
Data correspond to usage on the plateform after 2015. The current usage metrics is available 48-96 hours after online publication and is updated daily on week days.
Initial download of the metrics may take a while.