Free Access
Fig. 3
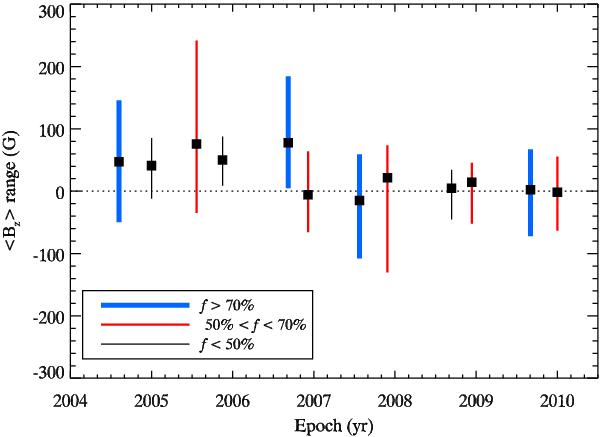
Range of longitudinal field variation with rotational phase for different epochs of II Peg observations. The line thickness is proportional to the phase coverage f. The squares show longitudinal field averaged over rotational phase.
Current usage metrics show cumulative count of Article Views (full-text article views including HTML views, PDF and ePub downloads, according to the available data) and Abstracts Views on Vision4Press platform.
Data correspond to usage on the plateform after 2015. The current usage metrics is available 48-96 hours after online publication and is updated daily on week days.
Initial download of the metrics may take a while.