Fig. 11
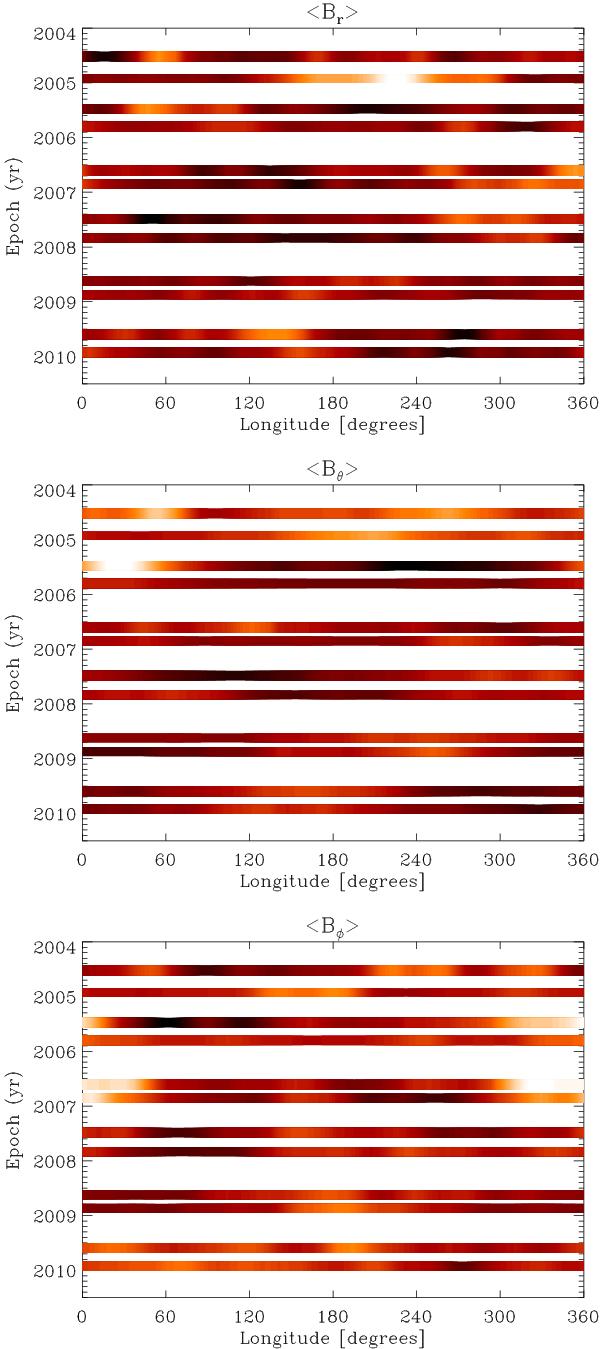
Magnetic field components (top: radial field, middle: meridional field, bottom: azimuthal field) averaged over the latitude interval −60° to 90° from each ZDI map. Each stripe represents the average field from one ZDI map, extended over the time axis to help the visualisation. The stripes are organised as function of time, according to their observational epoch, running from top to bottom. Dark colours represent negative polarities, bright colours positive ones; in all figures a linear colour table with minimum of −300 G and maximum of 300 G has been used.
Current usage metrics show cumulative count of Article Views (full-text article views including HTML views, PDF and ePub downloads, according to the available data) and Abstracts Views on Vision4Press platform.
Data correspond to usage on the plateform after 2015. The current usage metrics is available 48-96 hours after online publication and is updated daily on week days.
Initial download of the metrics may take a while.