Free Access
Fig. 1
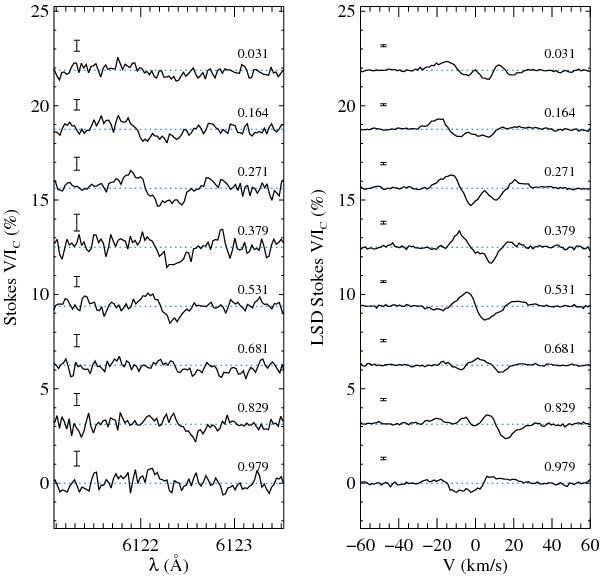
Comparison of the Stokes V profiles of the Ca i 6122.2 Å line (left panel) with the scaled LSD V profiles (right panel) at epoch 2004.6. The spectra for different rotational phases are shifted vertically. The 1-σ error bars are indicated on the left side of each panel.
Current usage metrics show cumulative count of Article Views (full-text article views including HTML views, PDF and ePub downloads, according to the available data) and Abstracts Views on Vision4Press platform.
Data correspond to usage on the plateform after 2015. The current usage metrics is available 48-96 hours after online publication and is updated daily on week days.
Initial download of the metrics may take a while.