Fig. 13
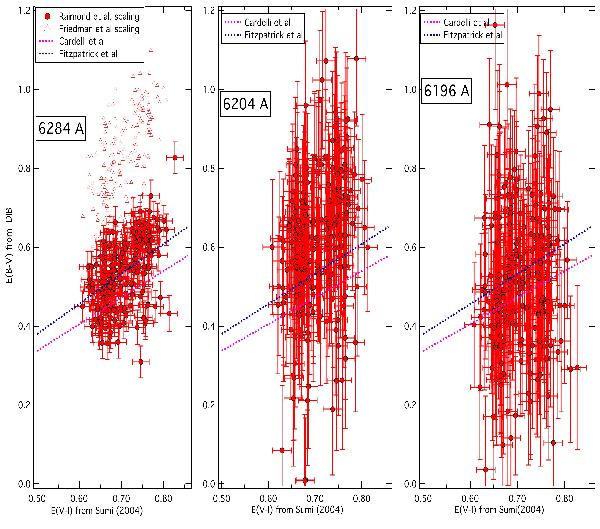
Color excess EB − V derived from the three DIBs as a function of the EV − I value interpolated within the Sumi (2004) map at the locations of the target stars. EB − Vs here are obtained using the Raimond et al. (2012) and Puspitarini et al. (2012, priv. comm.) average relationships based on FEROS data. The blue and pink dotted lines correspond to color excess relationships based on the Fitzpatrick (1999) and Cardelli et al. (1989) extinction curves and Rv = 3.1 (see text). In the case of the DIBs 6283.8 Å we also show the color excess values deduced from the Friedman et al. (2011) average relationships (open triangles).
Current usage metrics show cumulative count of Article Views (full-text article views including HTML views, PDF and ePub downloads, according to the available data) and Abstracts Views on Vision4Press platform.
Data correspond to usage on the plateform after 2015. The current usage metrics is available 48-96 hours after online publication and is updated daily on week days.
Initial download of the metrics may take a while.