Fig. 9
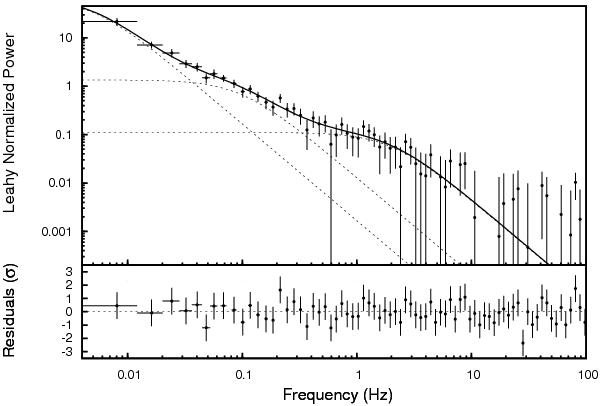
Top panel: power spectrum obtained by averaging 242 intervals, each ≃ 124 s long, and logarithmically re-binning the spectrum with a factor of 1.1. The white noise level of 1.9880(4), evaluated by modelling the spectrum between 0.5 and 2 kHz with a constant, is subtracted from each power estimate. Bottom panel: residuals in units of σ of the power spectrum with respect to the best-fitting model composed of three lorentzians centred at zero frequency.
Current usage metrics show cumulative count of Article Views (full-text article views including HTML views, PDF and ePub downloads, according to the available data) and Abstracts Views on Vision4Press platform.
Data correspond to usage on the plateform after 2015. The current usage metrics is available 48-96 hours after online publication and is updated daily on week days.
Initial download of the metrics may take a while.