Free Access
Fig. 10
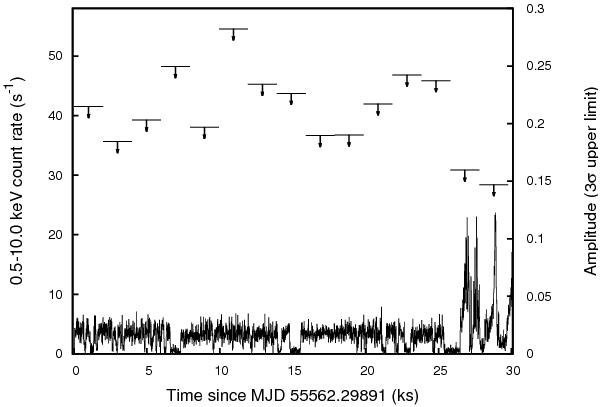
Right scale: upper limits at a 3σ confidence level on the pulse amplitude during the EPIC-pn observation of XSS J1227, as obtained by performing a QCRT over 1983.7 s long intervals (see text). Left scale: the net 0.5–10 keV light curve recorded by the EPIC-pn is also over-plotted.
Current usage metrics show cumulative count of Article Views (full-text article views including HTML views, PDF and ePub downloads, according to the available data) and Abstracts Views on Vision4Press platform.
Data correspond to usage on the plateform after 2015. The current usage metrics is available 48-96 hours after online publication and is updated daily on week days.
Initial download of the metrics may take a while.