Fig. 1
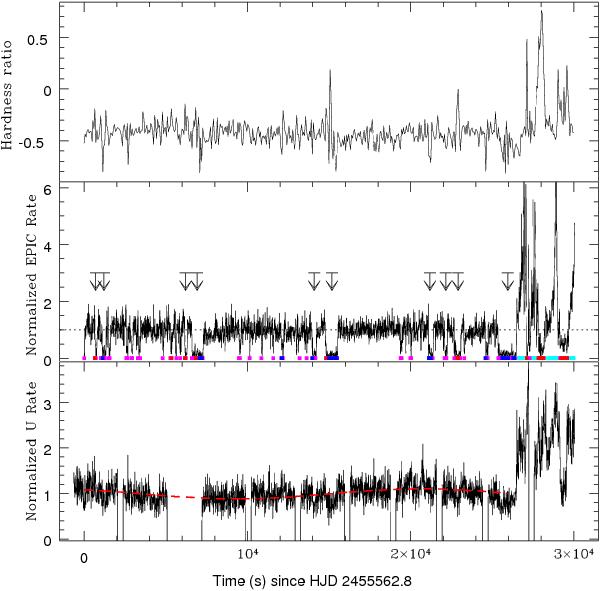
Bottom panel: net U band light curve with a 10 s binning time. Count rates are normalized to the average persistent quiescence value. A sinusoidal fit with a period of 6.4 h is also reported. Gaps are due to the OM fast acquisition mode. Middle panel: the EPIC-pn net light curve in the 0.3 − 10 keV range with a 10 s binning time. The count rate is normalized to the average quiescent value. Flares are marked in cyan, dips with no spectral change in magenta, dips showing a softening are marked in blue, while hard dips are marked in red. Arrows mark ten long dips used to study the CCF and spectra. Top panel: the hardness ratio between the 0.3 − 2 keV and 2 − 10 keV bands with binning time of 60 s. (See electronic edition for colour version.)
Current usage metrics show cumulative count of Article Views (full-text article views including HTML views, PDF and ePub downloads, according to the available data) and Abstracts Views on Vision4Press platform.
Data correspond to usage on the plateform after 2015. The current usage metrics is available 48-96 hours after online publication and is updated daily on week days.
Initial download of the metrics may take a while.