Fig. 9
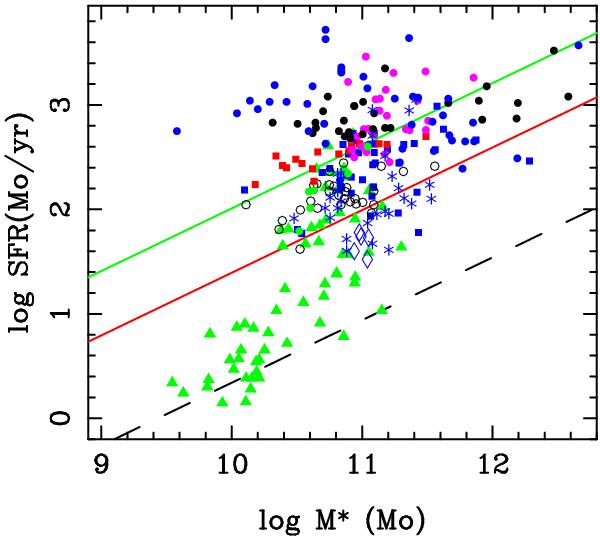
The star formation rate (SFR) obtained from the far infrared luminosity, versus stellar mass of galaxies in our sample (filled black circles for 0.2 < z < 0.6, and filled blue circles for 0.6 < z < 1.0), compared to the sample of Da Cunha et al. (2010, filled red squares), Fiolet et al. (2009, filled magenta circles), Gao & Solomon (2004, filled green triangles), Solomon et al. (1997, filled blue squares), Chung et al. (2009, open circles), Geach et al. (2009, 2011, blue diamonds), Daddi et al. (2010, filled green circles), and Genzel et al. (2010, blue asterisks). The black dashed line represents the star-forming galaxy main sequence at z = 0, the red filled line the main sequence at z = 1, and the green filled line the main sequence at z = 2. All three lines have an adopted slope of 0.6 (Karim et al. (2011).
Current usage metrics show cumulative count of Article Views (full-text article views including HTML views, PDF and ePub downloads, according to the available data) and Abstracts Views on Vision4Press platform.
Data correspond to usage on the plateform after 2015. The current usage metrics is available 48-96 hours after online publication and is updated daily on week days.
Initial download of the metrics may take a while.