Fig. 8
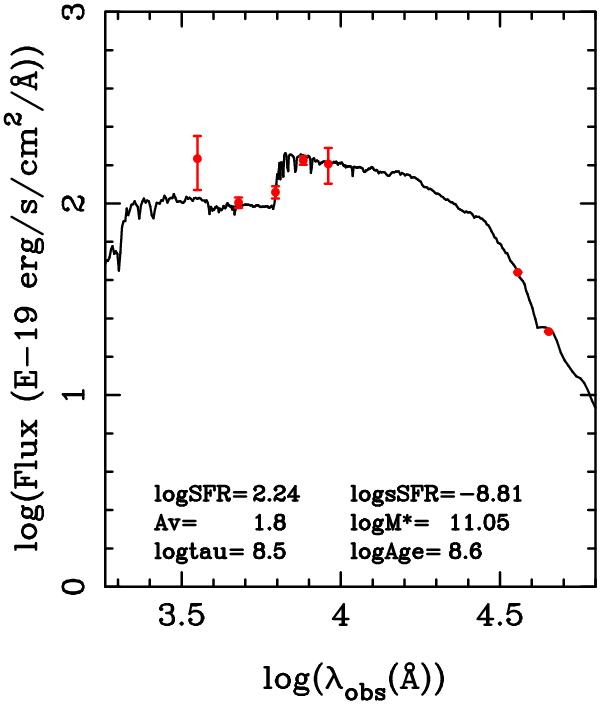
Spectral energy distribution of S43 (shown here as a representative example), based on optical/near-IR broadband photometry. The red points with error bars represent the observations of SDSS (ugriz bands), and of Spitzer/IRAC 3.6 and 4.5 μm observations. The black curve is the overplotted best-fit stellar synthesis model, obtained with the FAST code (see text). An exponential star-formation history, where time scale tau is assumed, with a Salpeter IMF. Values for tau and population age are given in yr, as well as stellar mass (M⊙), visual extinction (mag) SFR (M⊙/yr), or specific SFR (yr-1). All values are in log, except Av.
Current usage metrics show cumulative count of Article Views (full-text article views including HTML views, PDF and ePub downloads, according to the available data) and Abstracts Views on Vision4Press platform.
Data correspond to usage on the plateform after 2015. The current usage metrics is available 48-96 hours after online publication and is updated daily on week days.
Initial download of the metrics may take a while.