Fig. 7
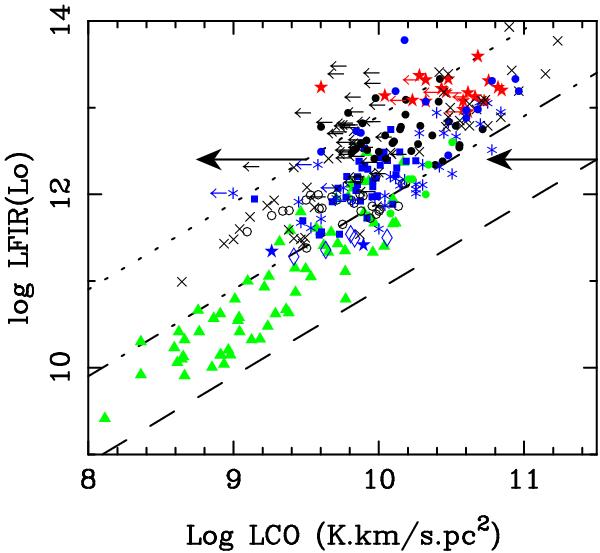
Correlation between FIR and CO luminosities, for our sample (filled black circles, and arrows for upper limits) and other galaxies from the literature (same symbols as in Fig. 6). The 3 lines are for LFIR/M(H2) = 10, 100 and 1000 L⊙/M⊙ from bottom to top, assuming a conversion factor α = 0.8 M⊙ (Kkms-1 pc2)-1. The same lines correspond to gas depletion time scales of 580 (bottom), 58 (middle) and 5.8 Myr (top). The arrows indicate the direction and amount by which these lines would move if the Milky Way CO-to-H2 conversion factor was used.
Current usage metrics show cumulative count of Article Views (full-text article views including HTML views, PDF and ePub downloads, according to the available data) and Abstracts Views on Vision4Press platform.
Data correspond to usage on the plateform after 2015. The current usage metrics is available 48-96 hours after online publication and is updated daily on week days.
Initial download of the metrics may take a while.