Fig. 6
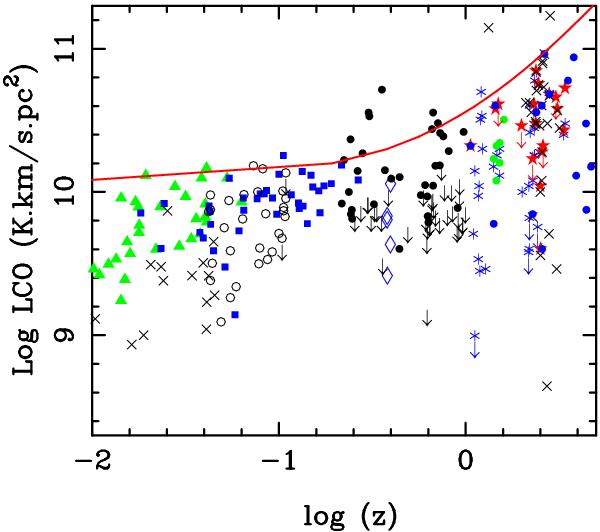
Measured CO luminosities, corrected for amplification when known, but not for gas excitation, as a function of redshift. We compare our points (filled black circles, and arrows as upper limits) with a compilation of high-z molecular gas surveys, and local ones: green filled triangles are from Gao & Solomon (2004), filled blue squares from Solomon et al. (1997), open circles from Chung et al. (2009), open blue diamonds from Geach et al. (2009, 2011), black crosses from Iono et al. (2009), red stars from Greve et al. (2005), green filled circles from Daddi et al. (2010), blue asterisks from Genzel et al. (2010), and blue filled circles from Solomon & vanden Bout (2005). For illustration purposes only, the red curve is the power law in (1 + z)1.6 for ΩH2/ΩHI proposed by Obreschkow & Rawlings (2009).
Current usage metrics show cumulative count of Article Views (full-text article views including HTML views, PDF and ePub downloads, according to the available data) and Abstracts Views on Vision4Press platform.
Data correspond to usage on the plateform after 2015. The current usage metrics is available 48-96 hours after online publication and is updated daily on week days.
Initial download of the metrics may take a while.