Fig. 17
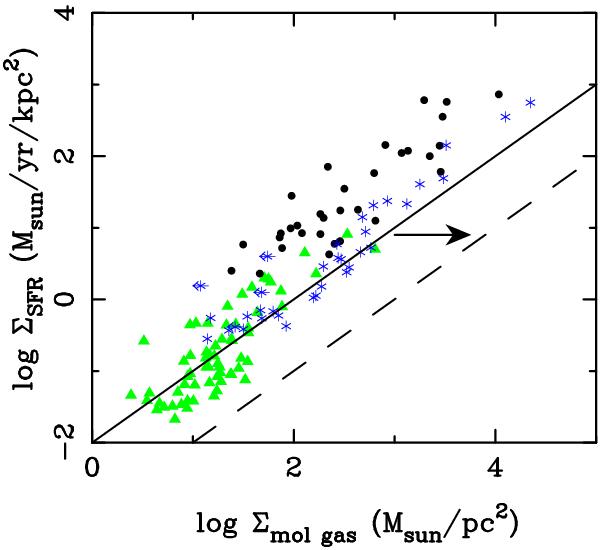
Kennicutt-Schmidt relation between the gas surface density and the SFR surface density for the galaxies of our sample (filled black dots), compared to the galaxies from Gao & Solomon (2004, filled green triangles), and from Genzel et al. (2010, blue asterisks). The full line corresponds to a depletion time of 100 Myr, and the dash line to 1 Gyr. A common conversion factor of α = 0.8 has been adopted here. The arrow indicates the direction and extent that all points will move, were an MW conversion factor to be used.
Current usage metrics show cumulative count of Article Views (full-text article views including HTML views, PDF and ePub downloads, according to the available data) and Abstracts Views on Vision4Press platform.
Data correspond to usage on the plateform after 2015. The current usage metrics is available 48-96 hours after online publication and is updated daily on week days.
Initial download of the metrics may take a while.