Fig. 16
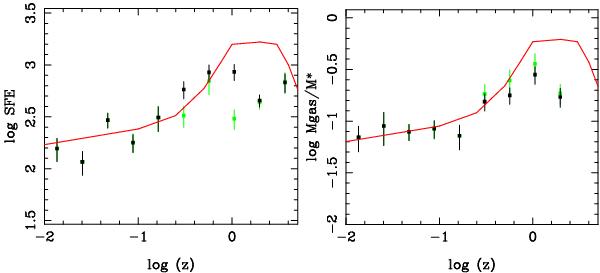
Evolution with redshift of averaged quantities, SFE to the left, and gas-to-stellar mass ratio to the right. The average of only detected points is plotted in green, and with the 3σ upper limits in black (for high-z samples only). The error bars are the statistical ones following the square root of the number of points averaged. The red line is the same as in Figs. 11 and 14.
Current usage metrics show cumulative count of Article Views (full-text article views including HTML views, PDF and ePub downloads, according to the available data) and Abstracts Views on Vision4Press platform.
Data correspond to usage on the plateform after 2015. The current usage metrics is available 48-96 hours after online publication and is updated daily on week days.
Initial download of the metrics may take a while.