Fig. 5
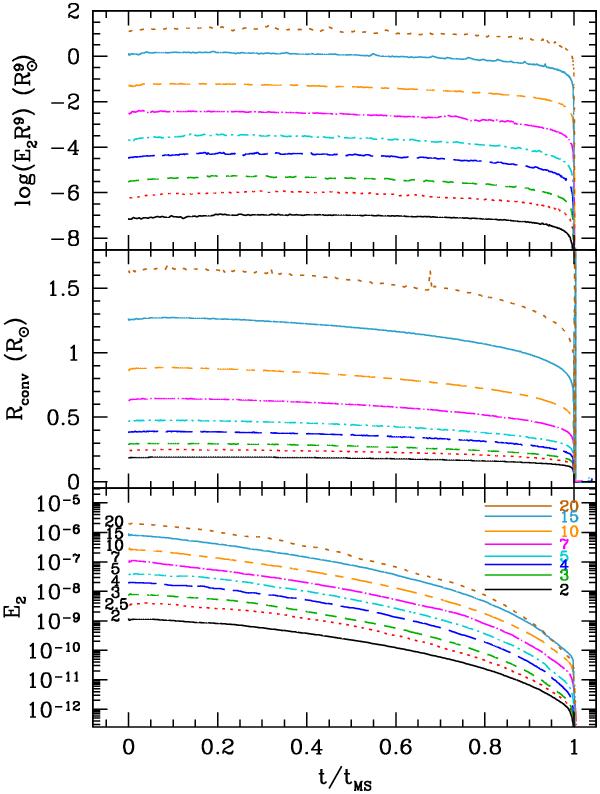
Evolution of the tidal torque constant E2 (bottom panel), radius of the convective core (middle) and the quantity  for solar composition models of mass M = 2, 2.5, 3.0, 4.0, 5.0, 7.0 10, 15 and 20 M⊙ as a function of the normalised main sequence lifetime. In each panel, the highest mass track corresponds to the top curve. In the lower panel, the solid lines on the upper right corner indicate the (constant) values of E2 for each mass as provided by Eq. (51).
Current usage metrics show cumulative count of Article Views (full-text article views including HTML views, PDF and ePub downloads, according to the available data) and Abstracts Views on Vision4Press platform.
Data correspond to usage on the plateform after 2015. The current usage metrics is available 48-96 hours after online publication and is updated daily on week days.
Initial download of the metrics may take a while.